Interactive & Dynamic Force-Directed Graphs with D3
This post has originally been written for NinjaConcept on Medium.

Preview of the final product with a custom "space" design (replaced the real data with mocks)
Many companies have a tremendous amount of data which is not just hard to maintain and manage, but also hard to understand and analyse. Here, data visualisation should find a remedy. The main goal is to communicate information clearly and efficiently which improves the overall experience.
In this post, I want to explain how we, at NinjaConcept, used D3 to create an interactive and dynamic force-directed graph which helped us to display nested data with complex relations in a simple natural way.
Background
Before we start, I want to explain which requirements we had to fulfill. This might help to understand our decisions better.
Requirements
First of all, the data we had to display was composed of both specially prepared data as well as extractions of the companies long-standing knowledge management system(s). The hardware requirement was very interesting, too. The graph would have to be build primarily for the new Microsoft Surface Hub, which had a lot of fun playing with. Though, the exiting part was to create a touch-focused interactive app that leverages the advantage of the multi-touch device.
Fun fact: We had been able to track up to 13 different fingers at once! Great work, Microsoft.
Why D3?
As soon as we knew all of the customers requirements, we had to think about which technologies we would use to build the application. After several research and comparison, we chose to use React as our primary user interface library which we would later integrate with D3 and a Meteor backend to serve all the data and other services.
We chose D3 not just because of its popularity and bulletproof core, but especially because of the amazing physical tools provided by d3-force.
Data
D3 is all about (complex) data visualisation. Our goal was to build a force-directed graph similar to this example by D3's creator Mike Bostock himself. It is based on d3-force and uses the forceSimulation API.
Nodes
Every simulation effectively takes a list of data objects and uses them as nodes. Think of those nodes as the data bubbles in the above mentioned example.
For simplicity, we are using a very basic example set of nodes to focus on the implementation. We are using the following list of animals and animal species, where the animals are sub-nodes of the species.
[
  { "id": "mammal", "group": 0, "label": "Mammals", "level": 1 },
  { "id": "dog", "group": 0, "label": "Dogs", "level": 2 },
  { "id": "cat", "group": 0, "label": "Cats", "level": 2 },
  { "id": "fox", "group": 0, "label": "Foxes", "level": 2 },
  { "id": "elk", "group": 0, "label": "Elk", "level": 2 },
  { "id": "insect", "group": 1, "label": "Insects", "level": 1 },
  { "id": "ant", "group": 1, "label": "Ants", "level": 2 },
  { "id": "bee", "group": 1, "label": "Bees", "level": 2 },
  { "id": "fish", "group": 2, "label": "Fish", "level": 1 },
  { "id": "carp", "group": 2, "label": "Carp", "level": 2 },
  { "id": "pike", "group": 2, "label": "Pikes", "level": 2 }
]
The key is a unique node id and the level references the level of nesting. The group references one of these groups:
{
  "0": "mammal",
  "1": "insect",
  "2": "fish"
}
Links
Another important feature of force simulations are links. They connect nodes to display (complex) relations. Every link needs to have at least a source and a target. Both are ids referencing one of the above nodes.
Next to special links, every sub-node (with level > 1) is at least linked to its parent node. We are using the following links:
[
  { "target": "mammal", "source": "dog", "strength": 0.7 },
  { "target": "mammal", "source": "cat", "strength": 0.7 },
  { "target": "mammal", "source": "fox", "strength": 0.7 },
  { "target": "mammal", "source": "elk", "strength": 0.7 },
  { "target": "insect", "source": "ant", "strength": 0.7 },
  { "target": "insect", "source": "bee", "strength": 0.7 },
  { "target": "fish", "source": "carp", "strength": 0.7 },
  { "target": "fish", "source": "pike", "strength": 0.7 },
  { "target": "cat", "source": "elk", "strength": 0.1 },
  { "target": "carp", "source": "ant", "strength": 0.1 },
  { "target": "elk", "source": "bee", "strength": 0.1 },
  { "target": "dog", "source": "cat", "strength": 0.1 },
  { "target": "fox", "source": "ant", "strength": 0.1 },
  { "target": "pike", "source": "dog", "strength": 0.1 }
]
Implementation
Before we finally start with the implementation, let me describe how we went on. First of all we tried to simply display all the nodes in colored groups. Then we'd add relations (links) and user interaction through touch events. Afterwards we made the whole graph dynamic by default which means adding and removing nodes and links depending on the current selection. Finally, we applied some styling to make the whole graph not only feel great, but actually look great as well.
Disclaimer: The code showed below is written in ECMAScript 2015, although the linked Gists (Bl.ocks) are written in good-old ES5 for compatibility reasons. I will add a full demo including both ES5 and ECMAScript 2015 versions at the end. Cursive words refer to variables or parts of the code itself.
Displaying Nodes
To start simple, first of all we need to somehow display our data in a force-directed graph using D3. Luckily, this is really straight-forward as we can just take the responsible code snippets from the above mentioned example.
Let's start by selecting a svg element with D3, which will function as a canvas for our graph later. We then set its width and height to fill the window.
const width = window.innerWidth
const height = window.innerHeight
const svg = d3.select('svg').attr('width', width).attr('height', height)
Now that we have our container ready, we can create forceSimulation instance. We also add two different forces. The first one, charge is a global force that affects every node. It simulates electrostatic effects, which makes the graph feel organic and natural as the nodes affect each other. If we'd use a positive strength, it'd simulate a gravitational pull. The second one, center, simply translates all nodes to visually move them into the center of the svg element.
const simulation = d3
  .forceSimulation()
  .force('charge', d3.forceManyBody().strength(-20))
  .force('center', d3.forceCenter(width / 2, height / 2))
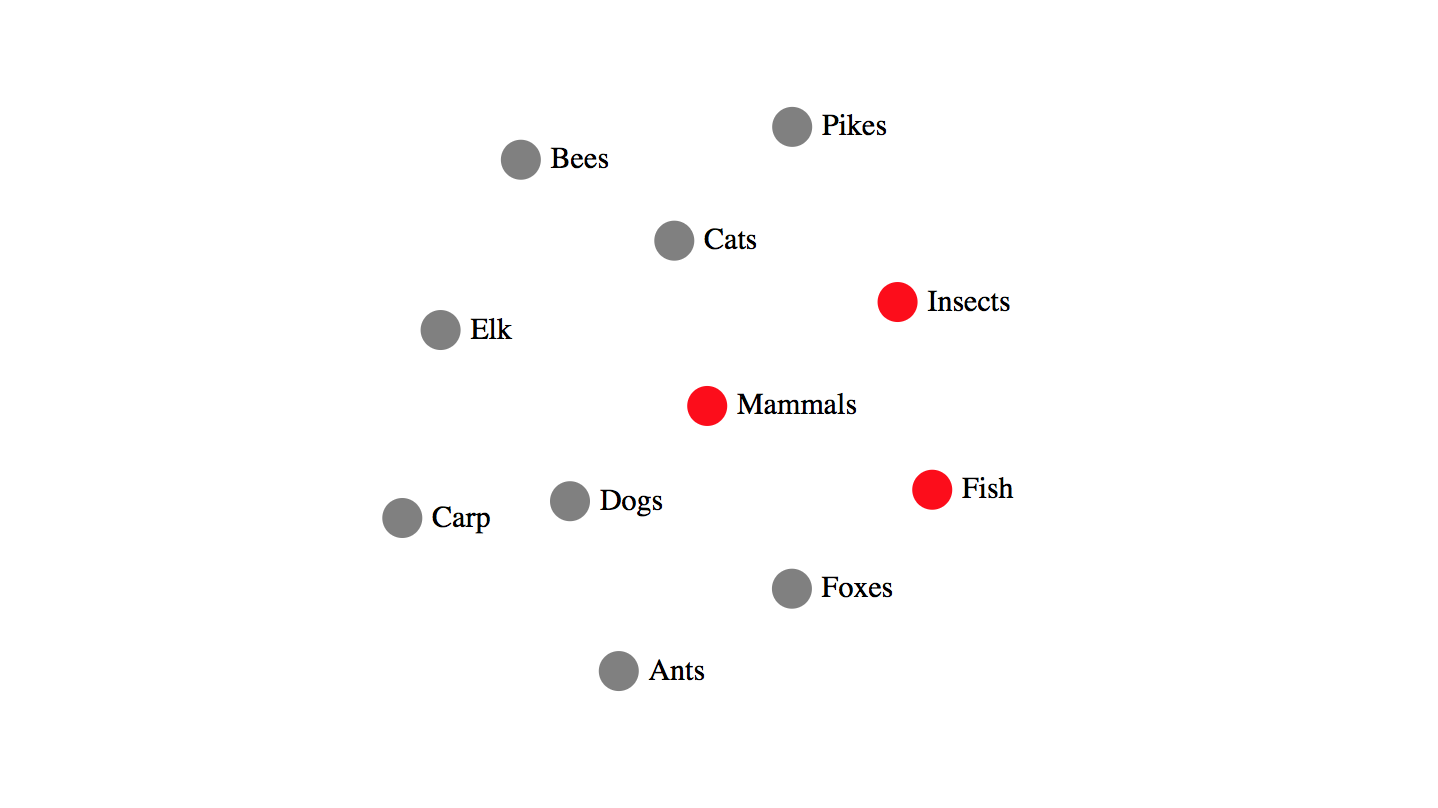
To draw the circle and text elements (nodes), we will add two additional g elements and use the nodes-array as data source. In order to differentiate species from animals, we will use different colors for their respective circles. Despite to basic attributes such as r, fill or font-size, we also used dx and dy to relatively position the text elements to the right of the nodes.
function getNodeColor(node) {
  return node.level === 1 ? 'red' : 'gray'
}
const nodeElements = svg
  .append('g')
  .selectAll('circle')
  .data(nodes)
  .enter()
  .append('circle')
  .attr('r', 10)
  .attr('fill', getNodeColor)

const textElements = svg
  .append('g')
  .selectAll('text')
  .data(nodes)
  .enter()
  .append('text')
  .text((node) => node.label)
  .attr('font-size', 15)
  .attr('dx', 15)
  .attr('dy', 4)
Finally, we need to start the simulation and define a tick functions that is executed on every simulation tick. There, we will basically update the coordinates of both node and text elements.
simulation.nodes(nodes).on('tick', () => {
  nodeElements.attr('cx', (node) => node.x).attr('cy', (node) => node.y)
  textElements.attr('x', (node) => node.x).attr('y', (node) => node.y)
})
Relations
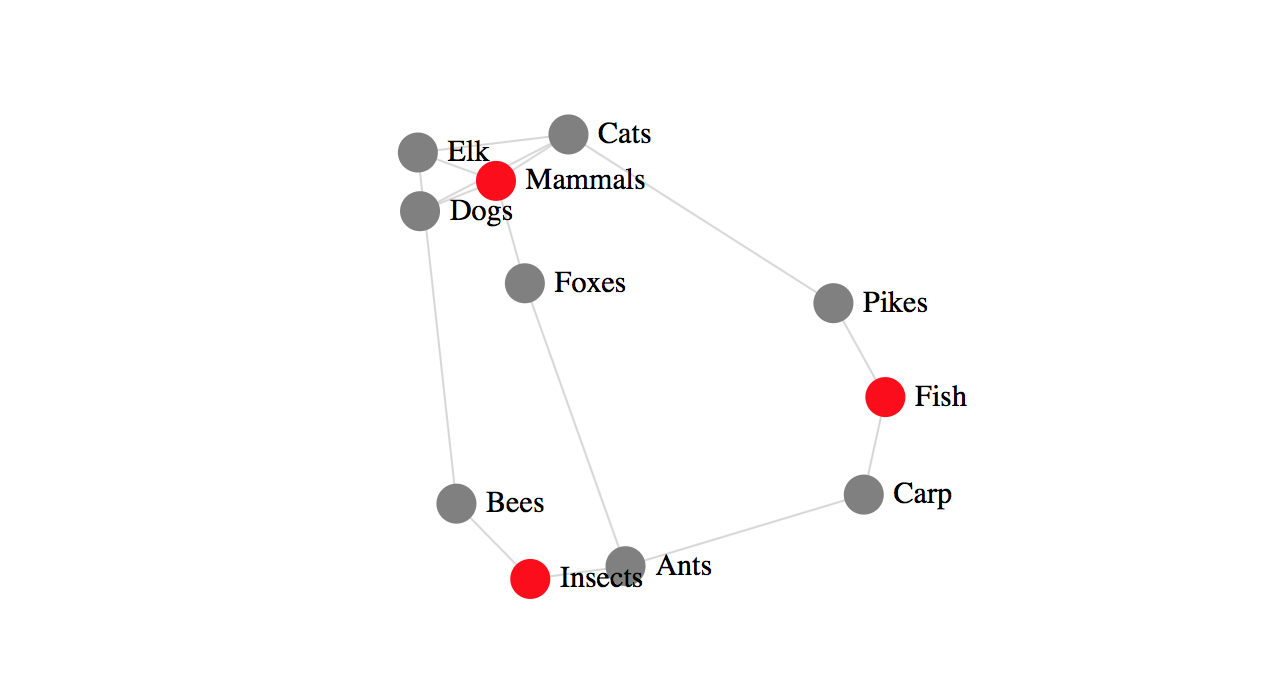
With our basic data displayed, we now want to show all the relations (links) to understand the connections between the nodes. Links also create forces which either push nodes together or apart depending on the applied strength. This is the point where we make use of the above defined strength for each link: specie-animal relations will have stronger forces to group the nodes tighter together, while cross-relations will pull much softer.
We start by adding the link force to our simulation.
simulation.force(
  'link',
  d3
    .forceLink()
    .id((link) => link.id)
    .strength((link) => link.strength)
)
Then we can create the line elements to display our links respectively. This works basically the same as the circle and text elements as well.
const linkElements = svg
  .append('g')
  .selectAll('line')
  .data(links)
  .enter()
  .append('line')
  .attr('stroke-width', 1)
  .attr('stroke', '#E5E5E5')
In order to move the links on every tick, we add the following snippet to the tick-function.
linkElements
  .attr('x1', (link) => link.source.x)
  .attr('y1', (link) => link.source.y)
  .attr('x2', (link) => link.target.x)
  .attr('y2', (link) => link.target.y)
In a final step we need to apply all links to the link force.
simulation.force('link').link(links)
User Interaction
To be able to interact with the graph, we at least need drag & drop. Again, D3 already provides a nice API to add D&D without pain. This was basically copied from the example as well. The alphaTarget adjustments help us to create a more natural feeling and to rerun the simulation after the drop.
Drag & Drop
const dragDrop = d3
  .drag()
  .on('start', (node) => {
    node.fx = node.x
    node.fy = node.y
  })
  .on('drag', (node) => {
    simulation.alphaTarget(0.7).restart()
    node.fx = d3.event.x
    node.fy = d3.event.y
  })
  .on('end', (node) => {
    if (!d3.event.active) {
      simulation.alphaTarget(0)
    }
    node.fx = null
    node.fy = null
  })
To activate the dragDrop events, we only need to add it to the nodeElements.
nodeElements.call(dragDop)
Highlight Selection
Additionally, we wanted to be able to select nodes in order to highlight their relations. To highlight the selection with all its connection we need to know two things.
- Who are the direct neighbors of the clicked node?
- Which links connect the clicked node with its neighbors?
This turns out to be very basic. We simply iterate all links and check if either the target or the source match the node's id. If yes, we add the counterpart, which then obviously is a direct neighbor. e.g. If the target.id matches the node.id, we add the source.id to the neighbors-list. (see getNeighbors)
To determine if a link connects the clicked node with one of its neighbors, we basically do the same. A link is a 'connection-link' if either the target.id or the source.id match the node.id. (see isNeighborLink)
function getNeighbors(node) {
  return links.reduce(
    (neighbors, link) => {
      if (link.target.id === node.id) {
        neighbors.push(link.source.id)
      } else if (link.source.id === node.id) {
        neighbors.push(link.target.id)
      }
      return neighbors
    },
    [node.id]
  )
}

function isNeighborLink(node, link) {
  return link.target.id === node.id || link.source.id === node.id
}
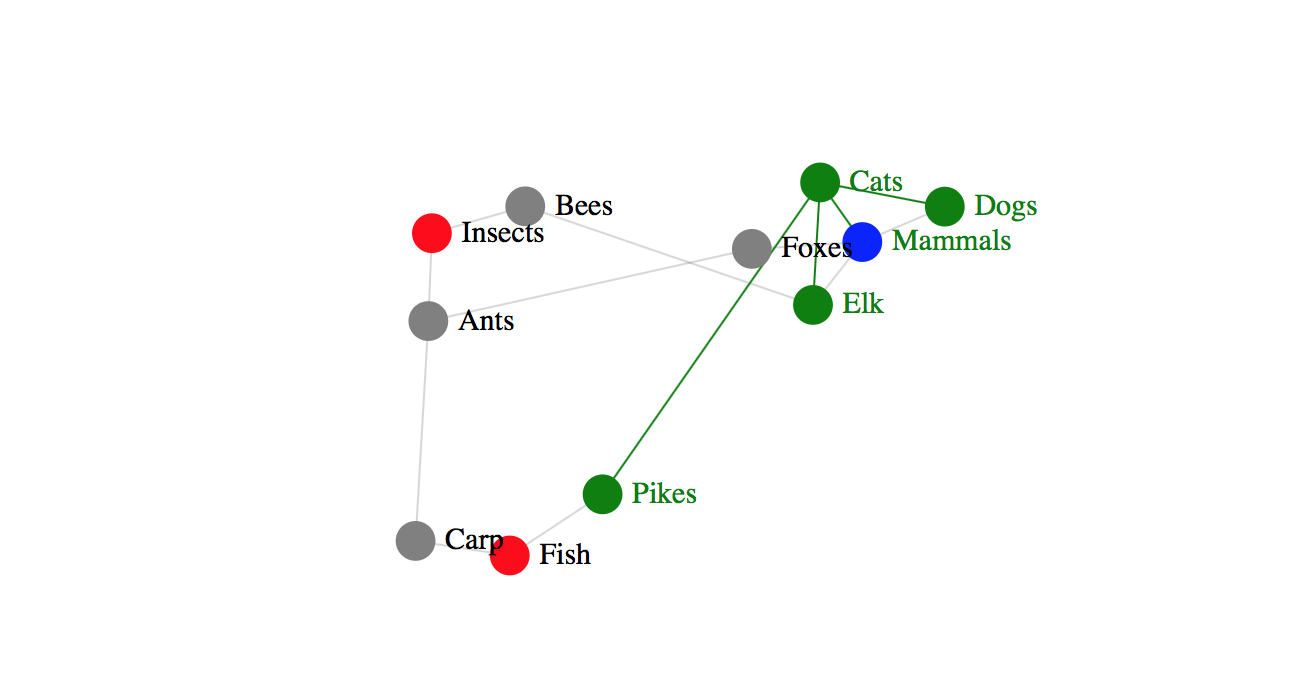
A simple way to visually highlight the nodes and links is by changing their colors. Therefore, we will use the below functions getTextColor, getLinkColor and getNodeColor (which replaces the previous getNodeColor). Now, all highlighted animal nodes will be colored green, all specie nodes blue. 'connection-links' will be colored in green as well.
function getNodeColor(node, neighbors) {
  if (neighbors.indexOf(node.id)) {
    return node.level === 1 ? 'blue' : 'green'
  }
  return node.level === 1 ? 'red' : 'gray'
}
function getTextColor(node, neighbors) {
  return neighbors.indexOf(node.id) ? 'green' : 'black'
}
function getLinkColor(node, link) {
  return isNeighborLink(node, link) ? 'green' : '#E5E5E5'
}
Bringing it all together, we have the following selectNode-function. It updates the colors of all nodes, texts and links depending on their 'neighborhood-status'.
function selectNode(selectedNode) {
  const neighbors = getNeighbors(selectedNode)
  nodeElements.attr('fill', (node) => getNodeColor(node, neighbors))
  textElements.attr('fill', (node) => getTextColor(node, neighbors))
  linkElements.attr('stroke', (link) => getLinkColor(selectedNode, link))
}
Last but not least, we need to add a click-event listener to every node element which calls selectNode.
nodeElements.on('click', selectNode)
Dynamic Updates
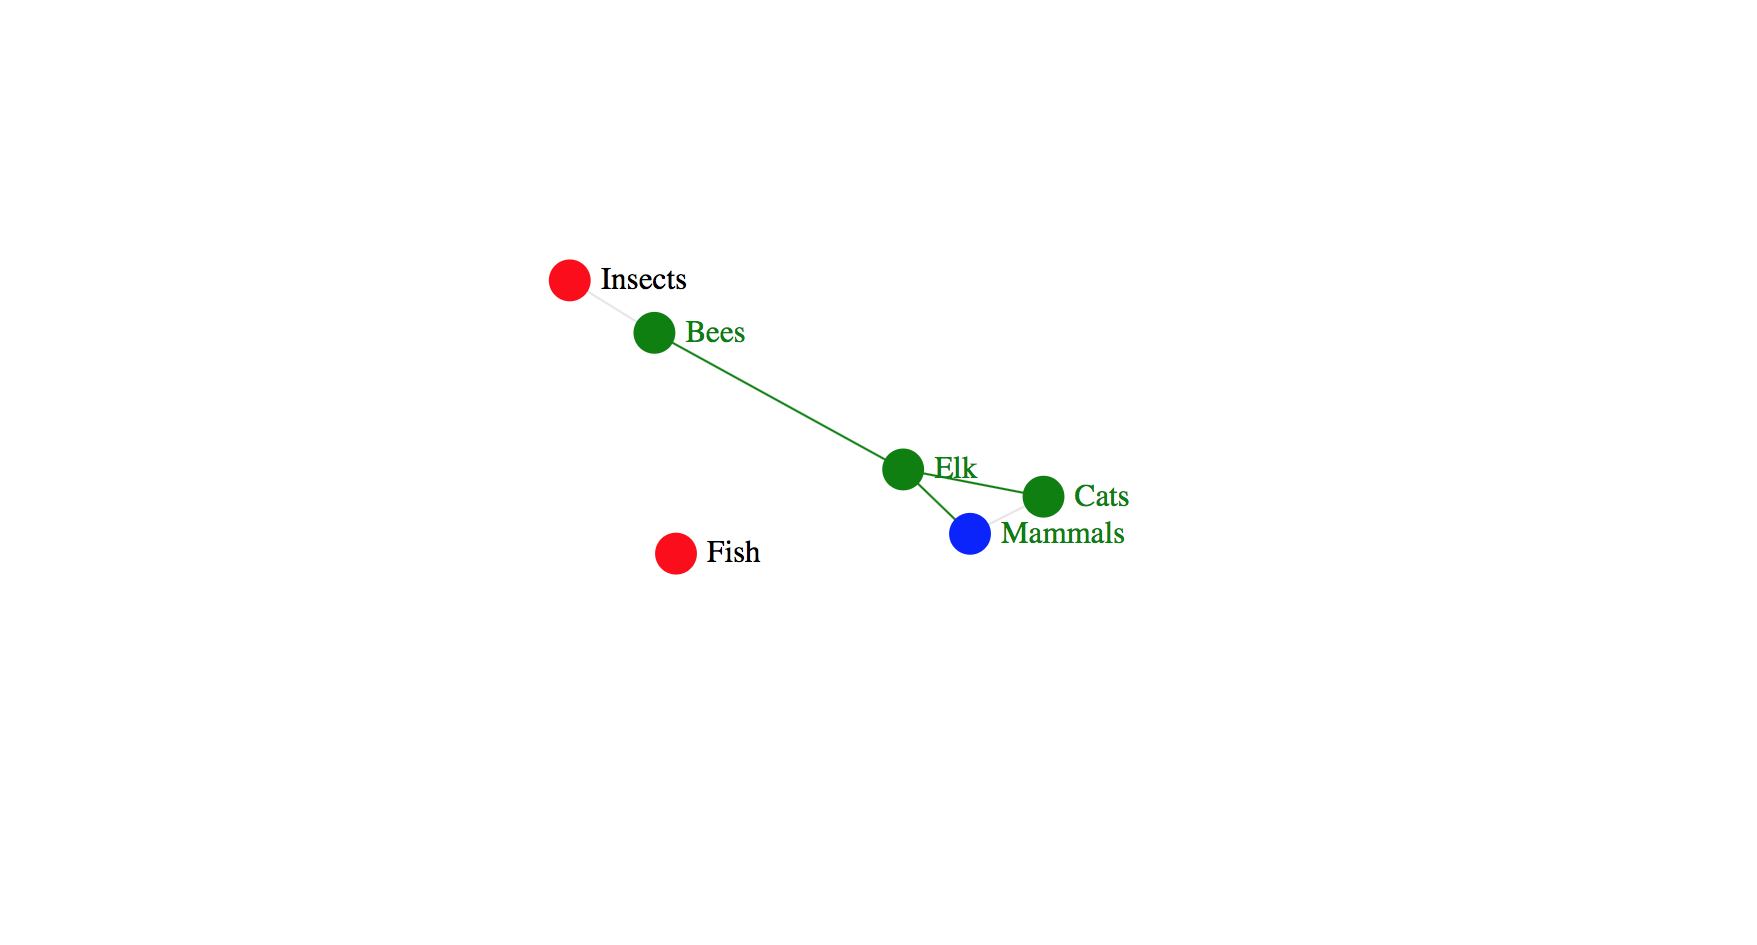
We already have a nice overview of our data, but that is still not enough. Often, data is not something static, but highly dynamic and frequently changes in the course of time. Therefore, we want the graph to update on every change. Also, with growing data, the graph gets more and more overcrowded and thus confusing and won't feel very user-friendly anymore. By hiding many sub-nodes to only show up when they're effectively required (e.g. if they have connections to the currently selected node).
That's why, for both cases, we need the ability to update the graph without a complete reload. Otherwise the simulation would restart and all efforts to ship a user-friendly application would ultimately be destroyed.
Luckily, D3 got us covered (again) with a great example on how to directly modify force-directed graphs. It uses the recommended update pattern, which can be described as: Mutate > Replace.
Updating the Data
First of all, we need to mutate our data. As we directly mutate the nodes and links, we use a copy with all nodes and links for reference. To actually mutate the nodes, we need to know which nodes get removed and which get added. We again use the neighbors to check which nodes to display. The species nodes should always be visible though.
Therefore we are generating a diff. Then, we simply use the diff to add and remove the affected nodes. The same method also applies to the links, although we do not need to mutate them, but can create a whole new array of links as well.
function updateData(selectedNode) {
  const neighbors = getNeighbors(selectedNode)
  const newNodes = baseNodes.filter((node) => {
    return neighbors.indexOf(node.id) > -1 || node.level === 1
  })
  const diff = {
    removed: nodes.filter((node) => newNodes.indexOf(node) === -1),
    added: newNodes.filter((node) => nodes.indexOf(node) === -1),
  }
  diff.removed.forEach((node) => nodes.splice(nodes.indexOf(node), 1))
  diff.added.forEach((node) => nodes.push(node))
  links = baseLinks.filter((link) => {
    return (
      link.target.id === selectedNode.id || link.source.id === selectedNode.id
    )
  })
}
Updating the Nodes & Links
Now that we have both nodes and links up-to-date, we need to update the DOM elements to correctly display the new data. D3 will try to reuse existing nodes to only mutate the minimum set of elements. That the reason why we mutate the data rather than overwriting it.
We need to modularize the element creation in order to react on updates. Using special svg groups helps us to better group the elements together:
const linkGroup = svg.append('g').attr('class', 'links')
const nodeGroup = svg.append('g').attr('class', 'nodes')
const textGroup = svg.append('g').attr('class', 'texts')

let linkElements, nodeElements, textElements
Updating existing elements requires to remove old ones and then merge the new ones. Again, D3 has a pretty straightforward pattern to do so.
linkElements = linkGroup.selectAll('line').data(links, (link) => {
  return link.target.id + link.source.id
})

// 1. remove old nodes
linkElements.exit().remove()

// 2. enter and create new ones
const linkEnter = linkElements
  .enter()
  .append('line')
  .attr('stroke-width', 1)
  .attr('stroke', 'rgba(50, 50, 50, 0.2)')

// 3. merge
linkElements = linkEnter.merge(linkElements)
We will repeat the exact same pattern for both nodes and texts as well and wrap the snippets inside the so-called updateGraph-method to later reuse it.
Updating the Simulation
Last but not least, we need to update the simulation to apply the above changes. The following function will update the graph using the above updateGraph-method. Afterwards it reinitialises the simulation with the new nodes and links and then restart it.
function updateSimulation() {
  updateGraph()
  simulation.nodes.on('tick' /* see above */)
  simulation.force('links')
  simulation.restart()
}
To dynamically update the graph depending on the users interaction, we can embed the updateData and updateSimulation-methods into the selectNode-method that is called on every node.
Styling & Visual Design
Now that we have all the logic ready to ship a highly dynamic and interactive graph, we can make it look awesome with basic styling techniques. I will not go into detail here, but just check out the preview in the beginning of this posts, to see what's possible without any further tooling and skill.
PS: Some convenient code snippets might have been dropped to keep this post as small and informative as possible. Especially talking about the 'Dynamic Updates' part, please refer to the code examples for further information. They also include useful code comments to get along.
Demo
All code examples are hosted on GitHub. We provide ready-to-run examples wrapped inside a .html file directly. Also, there is a code-folder that contains the complete code in modular ES2015 syntax.
Check it out: https://github.com/ninjaconcept/d3-force-directed-graph
Conclusion
To keep it short: Working with D3 is a pleasure.
We had a lot of fun experimenting with the force simulation API the result is yet quite impressive.